Fix the log parsing issue and analyze the logs in Splunk.
Please Read Before Starting Room
Quite a few times I got something wrong in my conf files for this room. After making changes to them, I found that Splunk didn’t pick up the changes after restarting it. Currently, the best solution I have to fix this is to terminate the machine and restart it. Because of this, please make sure you keep a copy of you conf files in notepad or what have you. So that once the machine restarts, you are able to easily and quickly make the files. If someone know a better way, please let me know and I will add an updated section. Thank you and enjoy!!!
Task 1 — FIXIT Challenge
In this challenge room, you will act as John, who has recently cleared his third screening interview for the SOC-L2 position at MSSP Cybertees Ltd, and a final challenge is ready to test your knowledge, where you will be required to apply the knowledge to FIX the problems in Splunk.
You are presented with a Splunk Instance and the network logs being ingested from an unknown device.

Pre-requisites
This challenge is based on the knowledge covered in the following rooms:
Room Machine
Before moving forward, start the lab by clicking the Start Machine button.
The lab will be accessible via split screen.
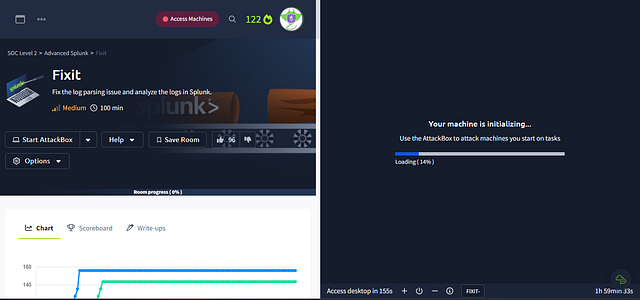
If the VM is not visible, use the blue Show Split View button at the top-right of the page.

Once the VM is in split screen view, you can click the two diagonal arrows button to show it on a full screen.

The VM will take 3-5 minutes to load properly. In this room, we will be working using the terminal of the VM and accessing the Splunk instance at MACHINE_IP:8000.
Note: Splunk is installed in the /opt/splunk directory, and you will be working in the App called Fixit.
Before Getting Started
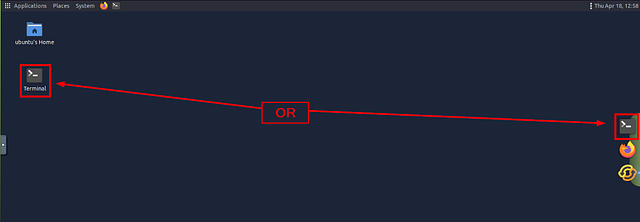
Open a terminal in the VM by clicking on either the desktop Terminal icon or the sideboard Terminal Icon.
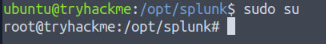
In the Terminal Window, let’s change directories. TryHackMe let us know that Splunk is installed at /opt/splunk. So using cd /opt/splunk, will put us in that directory.
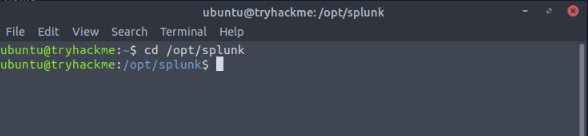
Last thing to do is switch to root user. We can do this by using the command sudo su.
We now have the terminal ready, time to get the Splunk Dashboard loaded.
To get to the Splunk Dashboard you can do it two ways. You can do it right on the VM using Firefox, or if you are on the VPN, you can do it right in your browser. I am on the VPN, so I will be doing it right from my browser. In a new tab in your browser, navigate to your MACHINESIP:8000. The initial Splunk screen will load.

On the left side of the screen is the apps, click on the FIXIT app.
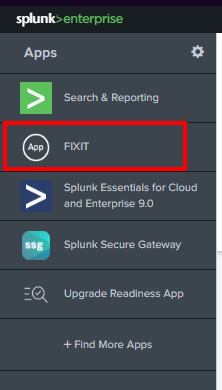
We are now ready to move forward.
Happy Fixing!
Q1: What is the full path of the FIXIT app directory?
From Task 5 of Splunk: Data Manipulation, it shows you where to find the Splunk Apps. Using the ls, we can confirm this by running the command ls etc/apps.

As we can see, the fixit app is in the etc/apps directory. Knowing we are already in the /opt/splunk/ , we can put it all together to get the answer.
A1: /opt/splunk/etc/apps/fixit
Challenge: FIXIT
This challenge is divided into three levels:
Level 1: Fix Event Boundaries
Fix the Event Boundaries in Splunk. As the image below shows, Splunk cannot determine the Event boundaries, as the events are coming from an unknown device.

Q2: What Stanza will we use to define Event Boundary in this multi-line Event case?
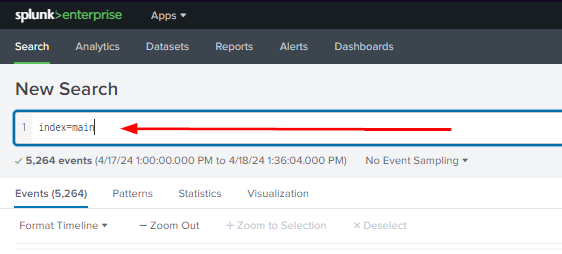
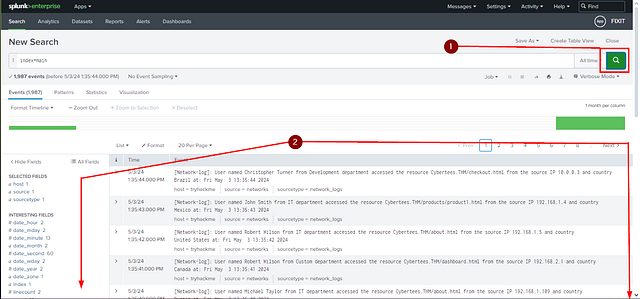
As shown in the picture, type index=main into the Splunk search field and press enter to search.
Looking over the logs, it appears they start with [Network-log]:.
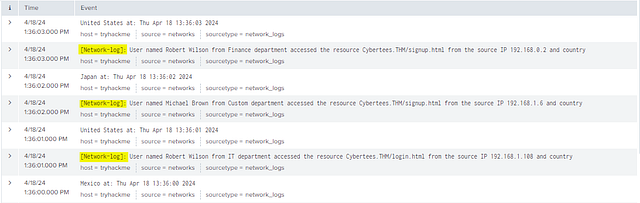
This gives us a place we can create a break so that the event will be together instead of split up. Since we want to break the event before [Network-log]: it gives us an indication of which stanza we need to use. Looking back at Task 4 of Splunk: Data Manipulation, we can find the Stanza need to achieve this. Once you find it type or copy and paste it into the THM answer field. The click Submit.
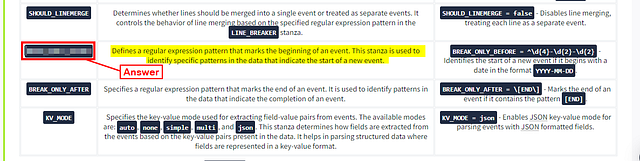
A2: BREAK_ONLY_BEFORE
Q3: In the inputs.conf, what is the full path of the network-logs script?
Again from Task 5 of Splunk: Data Manipulation, we learned the location of inputs.conf. Using that knowledge we can run the command cat etc/apps/fixit/default/inputs.conf .

The contents of the file will be output to the screen. You will see script://, the answer will be after that. Copy and paste it into the TryHackMe answer field and click Submit.
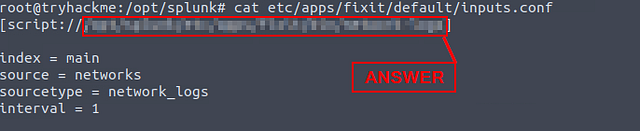
A3: /opt/splunk/etc/apps/fixit/bin/network-logs
Q4: What regex pattern will help us define the Event’s start?
Since we know where we need to break the event, let’s create a regex for it. We first need to copy the Sample Logs: that THM has given us. So we can check out regex against it.

Head over to regex101.com. Paste the Sample Logs into the TEST STRING area.
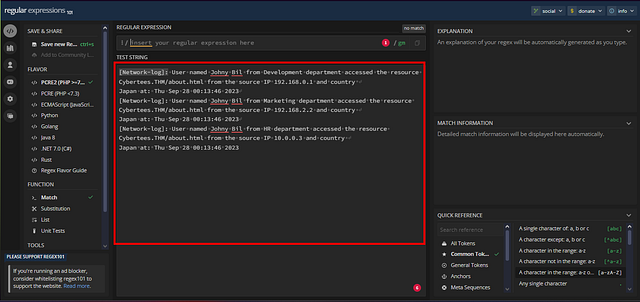
Since we know that the event starts with [Network-log]: , we can create a simple regex for it. We do need to make sure we use escape characters \, since we have the brackets. So the regex should look like \[Network-log\]:. If you typed it correct, you will see that [Network-log]: in the TEST STRING area will be highlighted blue. Also, keep the regex you just created in the regex bar. We will come back to this soon.

Copy and paste the regex query into the THM answer field. Then click Submit.
A4: [Network-log]:
Fixing The Multi-line Event
We need to use the knowledge we gained to from questions two and three to create the configuration file. Additionally, we will need the name of the source type as well. Looking back at the Splunk Dashboard we can see the name of the source-type under our event.

From Task 7 of Splunk: Data Manipulation, we learned that you need to edit the props.conf in the /opt/splunk/etc/apps/fixit/default directory. Using your favorite text editor, we create the file. For me I use VIM, so the command I used is vim etc/apps/fixit/default/props.conf and press enter.

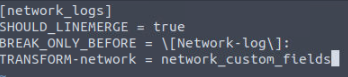
With VIM press i to enter insert mode, which allows you to type. Then we first need to declare the source-type encased in brackets, which would be [network_logs]. We then will add SHOULD_LINEMERGE = true , which will tell Splunk to put all the lines together without any breaks. We finally added BREAK_ONLY_BEFORE = and our regex from question 4, \[Network-log\]: .

We now need to save our config file. To do so in VIM, first press the esc button to exit insert mode. Then press :wq and enter to save and exit VIM. If successful you should be brought back to the command line.

Level 2: Extract Custom Fields
Once the event boundaries are defined, it is time to extract the custom fields to make the events searchable.
- Username
- Country
- Source_IP
- Department
- Domain
Sample Logs:
To create regex patterns, sample Network logs are shown below:
1
2
3
4
5
6
[Network-log]: User named Johny Bil from Development department accessed the resource Cybertees.THM/about.html from the source IP 192.168.0.1 and country
Japan at: Thu Sep 28 00:13:46 2023
[Network-log]: User named Johny Bil from Marketing department accessed the resource Cybertees.THM/about.html from the source IP 192.168.2.2 and country
Japan at: Thu Sep 28 00:13:46 2023
[Network-log]: User named Johny Bil from HR department accessed the resource Cybertees.THM/about.html from the source IP 10.0.0.3 and country
Japan at: Thu Sep 28 00:13:46 2023
Creating the Regex Pattern
To be completely honest with you, I previously went through and created a regex for each individual field. But after some research, realized that to properly create the custom fields for Splunk. You need to create essentially a regex one-liner. The way that we do this is any information we are not collecting for the custom field will be written out. While, any section encased in brackets () , will be considered a group. As more groups are created, each one’s position is incremented by 1. I’ll explain that soon, and have some screenshots to explain.
Username
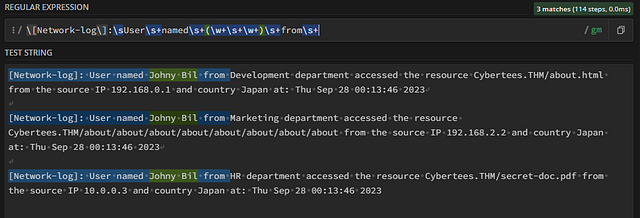
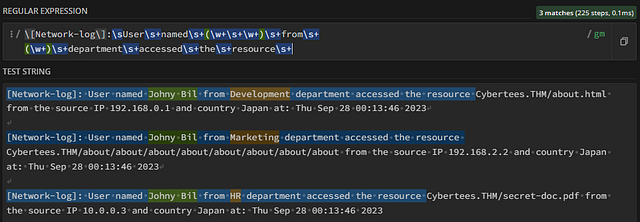
Let’s head over to regex101.com. So to begin we need to type out everything up until the username, as that is the first field we want to capture. You should still have the Network-logs (\[Network-log\]:) regex in the regex bar. Going from there, any whitespace that occurs one or more times is signified with the \s+. So the regex up until the first group or custom field, will look like \[Network-log\]:\s+User\snamed\s+ . Which will be confirmed by words being highlighted in blue.

To capture the Usernames into a group, we will put our regex between two brackets () . Since we don’t know for sure what the length of each word in a Username will be. We can use the regex \w+. The \w will match to any ascii character, while the + indicates that it will occur one or more times. Since we have a space between the first and second word of the Username we can add the \s and another \w+. Using this knowledge, let’s add to our regex. It should now look like this, \[Network-log\]:\s+User\s+named\s+(\w+\s+\w+) . If you have it correct, again you will see the Username highlighted in green. Which means that it is in a group. Which you can see in the MATCH INFORMATION. Our Usernames are not in Group 1! ( I do know that you see from in the results. This will be fixed next)

Department
Next up is the Department field. Which we only have one word between. Using what we know far, it should be easy to create. Adding it to our regex, the command should be, \[Network-log\]:\sUser\s+named\s+(\w+\s+\w+)\s+from\s+ . Additionally, we can see that it fixed the issue prior that popped up, where it said from was part of the Username.
Looking over the sample logs, it appears the Department names are one word basically. So we can use (\w+), to identify them. Our command is growing and should look like this, \[Network-log\]:\sUser\s+named\s+(\w+\s+\w+)\s+from\s+(\w+) . Looking in the MATCH INFORMATION, we can see the department is now in Group 2. Again, these groups will come into play later on when we create our transforms.conf file.

Domain
We now have some typing to do before we reach our next field. Using what we have done so far, let’s add from department until resource. Your regex should look like the following, \[Network-log\]:\sUser\s+named\s+(\w+\s+\w+)\s+from\s+(\w+)\s+department\s+accessed\s+the\s+resource\s+
Next up, Domain! And question 5!
Q5: What is the captured domain?
We are about half-way through the sample Network log. Let’s find the Domain. Looking at the sample logs, the domain is made up of one or more ascii characters. Separated by a period, followed by one or more ascii characters. Then we have some forward slashes in there as well. Meaning we have to match several different types of characters. So we can use a new regex we haven’t used yet, \S+. This will look for any non-whitespace character. Let’s place that in brackets and into the rest of our regex,\[Network-log\]:\sUser\s+named\s+(\w+\s+\w+)\s+from\s+(\w+)\s+department\s+accessed\s+the\s+resource\s+(\S+). The domain should be highlighted in purple now.

Type or copy and paste the answer in the THM answer field. The click Submit.
A5: Cybertees.THM
IP Address
Our next custom field will be the IP address. As we have done before, add the regex needed to include the text until the first digits of the IP address. It should look like the following, \[Network-log\]:\sUser\s+named\s+(\w+\s+\w+)\s+from\s+(\w+)\s+department\s+accessed\s+the\s+resource\s+(\S+)\s+from\s+the\s+source\s+IP\s+.

We have reached the IP address! The best way to describe an IP address when making a regex for it is: four octets or groups of digits, seperated by periods, that range from 1 to 3 character long, using digits 0 through 9. Using that understanding, let’s build our regex by looking at the first octet. Start with the bracket ( and ?:, which will inidcate that this group is a non-captured group. Looking over the first octet of numbers in the IP address. We will use \d which signifies a digit character. Since a digit can appear between 1 to 3 times in each octet, we can use the curly brackets { } with 1,3 in betwen to state on many times it can occur. Our regex at this point should look like this: (\d{1,3}. That covers the digits in the first octet, now we can add a period . after the second curly bracker } and another bracket to close the group ).
Now that we have (\d{1,3}.). Looking at the IP address, we can see that this exact same seqenence occurs two other times, for a total of three times. Meaning we can add the curly brackets again with a three inbetween them {3}. Finally, since the last octet is the same as the others we can reuse the same regex from within the brackets (), without ending it with a period. The regex full regex at this point should look like: \[Network-log\]:\sUser\s+named\s+(\w+\s+\w+)\s+from\s+(\w+)\s+department\s+accessed\s+the\s+resource\s+(\S+)\s+from\s+the\s+source\s+IP\s+((?:\d{1,3}\.){3}\d{1,3}). You can see that Group 4 in the MATCH INFORMATION, has the full IP address in it.
Country
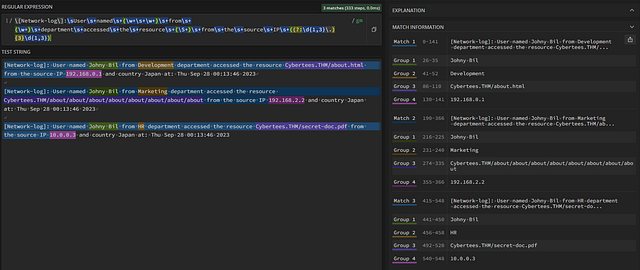
This time there is only two words before the field we are looking for. So as before add them to your regex, which should be \s+at\s+country. Now, time to get the last custom field. We need to account for countries that have two words as there name, example being United States. We first will start with []. To which we will place \w+\s+ inside, indicating our pattern. We will then add a plus +, to say it can occur one or more times. Lastly, outside the group we want to give the regex an ending point, so we add \s+at. Here is our final regex:\[Network-log\]:\sUser\snamed\s(\w+\s\w+)\sfrom\s(\w+)\sdepartment\saccessed\sthe\sresource\s(\S+)\sfrom\sthe\ssource\sIP\s((?:\d{1,3}\.){3}\d{1,3})\s+and\s+country\s([\w\s]+)\s+at. We can see the country is now in Group 5, and highlighted in red.

Quick Recap of Groups
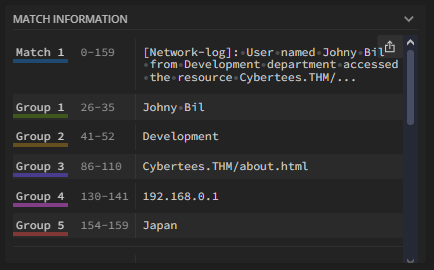
Looking over the different Groups in the MATCH INFORMATION section of regex101, we can see each of our custom fields. Here they are below:
- Username — Group 1
- Department — Group 2
- Domain — Group 3
- Source_IP — Group 4
- Country — Group 5
These will be important when we make the transforms.conf Splunk file.
Prepping the props.conf file
Before we created the transforms.conf file, we need to add a line the props.conf file that will point to the transforms.conf file. To do this we can open the props.conf file again in vim with vim etc/apps/fixit/default/props.conf. Again you can use your text editor of choice for this.

Pressing the letter o will enter into insert mode, below the line the cursor is on. In our case that should be the final line in the file. As we learned from Task 9 of Splunk: Data Manipulation, we need to add: TRANSFORM-$DescriptiveName = $Name_Look_To_In_Transform_File. Using this knowledge we can then make ours look like: TRANSFORM-network = network_custom_fields. Then we can save it with :wq.
Creating transforms.conf
The transforms.conf file will be located in the same directory as the props.conf file. So we can just change our last command a bit in the terminal. It should be vim etc/apps/fixit/default/transforms.conf, which will go ahead and create a blank file named transforms.conf in that location.

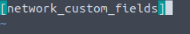
Press the letter i, to enter insert mode, so we can begin typing. Remember from our props.conf file, after TRANSFORM-network =, we named it network_custom_fields. We will put that between two square brackets []. So that the first line in the file should be [network_custom_fields].
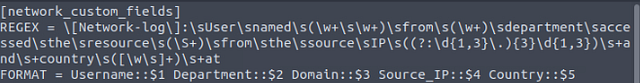
The next line we will indicate our regex we created, to do this we start with REGEX = , then paste the regex from regex101.com we created. This line should look like the following: \[Network-log\]:\sUser\s+named\s+(\w+\s+\w+)\s+from\s+(\w+)\s+department\s+accessed\s+the\s+resource\s+(\S+)\s+from\s+the\s+source\s+IP\s+((?:\d{1,3}\.){3}\d{1,3})\s+and\s+country\s+([\w\s]+)\s+at

On to the next line, we will declare the format/custom fields. We will be using the the group info we gained on regex101.com from our regex. First start the line off with FORMAT =, to indicate we are specifying the custom fields. Then using the format $CustomFieldName::$GroupNumber, adding a space in betwen to signafy the next field. Using this format with the custom field names and group numbers, it should look like the following: FORMAT = Username::$1 Department::$2 Domain::$3 Source_IP::$4 Country::$5
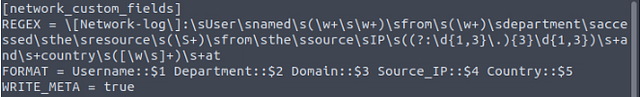
For the last line we need to add, WRITE_META = true . This line is needed as it will make sure that any fields added or modified by the transformation, are written back to the original event. With this final line added, we can save the transforms.conf file with :wq.
Creating fields.conf file
The last file we need to create is the fields.conf file. This file needs to be created in the same directory as transfroms.conf and props.conf. As before, using your favorite text editor, create the fields.conf file with:vim etc/apps/fixit/default/fields.conf

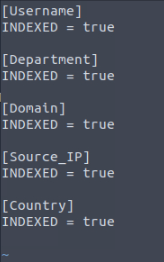
Remembering from Task 9 of Splunk: Data Manipulation room, you can see how the fields.conf file needs to be formatted. Simply put, you place the field name inside square brackets [], then the next line under you include INDEXED = true, finished off with a blank line before the next field name. Rinse and repeat, till you have all the fields in the fields.conf file. If you have completed it correctly, it should look like the screenshot below. You can now save the file with :wq.
Restarting Splunk
To have the new changes take effect, we need to restart Splunk. To do this from our current directory, we use the command bin/splunk restart and press enter.

It will take a few minutes to restart Splunk.
After Splunk restarts, you can go back to the Splunk dashboard ($MACHINE_IP:8000). Once back on the Splunk dashboard, click the search icon in the top right (green box with white magnifying glass in it) to refresh the search. Then scroll down so you can see the entire Fields section on the left side of the dashboard.
Once you can see the whole Fields section. We can now see 5 more fields towards the bottom, click on it.

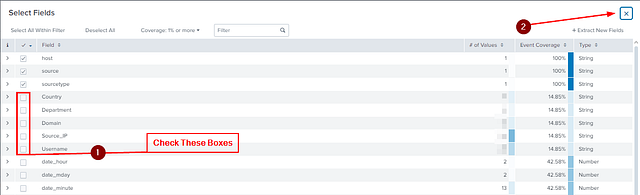
A Select Fields pop-up will appear. We can see that our custom fields appear in with all the fields. We can also see that the boxes next to them don’t have check marks. So check all the boxes, and then they will appear on the SELECTED FIELDS section of the Dashboard. Then you can close the window, by clicking the X in the top right.
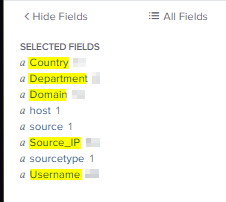
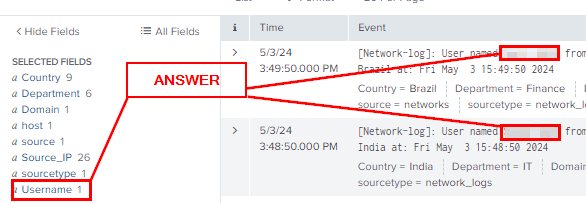
As mentioned above, we can now see our custom fields in the SELECTED FIELDS on the left side of the dashboard.
We are all set to begin our Analysis! Time to move onto Level 3!
Level 3: Perform Analysis on the FIXED Events
Once the custom fields are parsed, we can use those fields to analyze the Event logs. Examine the events and answer the questions.
If your regex is correct, you should be able to look at the custom fields in the SELECTED FIELDS section. To the right of the field name is the amount of captures for that for that field. Type this number into the TryHackMe answer field and click Submit.

Q6: How many countries are captured in the logs?
A6: 12
Q7: How many departments are captured in the logs?
A7: 6
Q8: How many usernames are captured in the logs?
A8: 28
Q9: How many source IPs are captured in the logs?
A9: 52
Q10: Which configuration files were used to fix our problem? [Alphabetic order: File1, file2, file3]
This question shouldn’t be hard to answer. As you just need to put in alphabetical order the three files we created to fix the multi-line event and create the custom fields. You can find all three in Task 9 of Splunk: Data Manipulation. Once you have found them or if you know what they are. Type them in alphabetical or in the TryHackMe answer field. Making sure you use a comma , and a space after the first two. Then click Submit.
A10: fields.conf, props.conf, transforms.conf
Q11: What are the TOP two countries the user Robert tried to access the domain from? [Answer in comma-separated and in Alphabetic Order][Format: Country1, Country2]
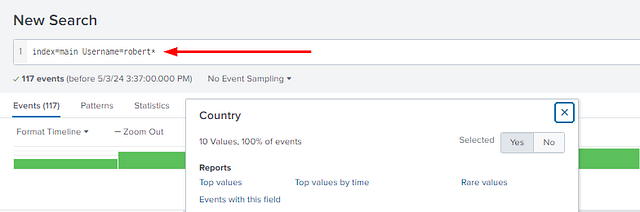
Using some of the Splunk SPL Skills, we can search for Usernames that begin with Robert. To do this in the search bar, after index=main, add Username=robert*. Then press enter to search

From the results, look at the SELECTED FIELDS. Click on Country.

A pop-up window will appear showing the top 10 results for the countires associated with the user robert. Lucky for you they are already in alphabetical order. Type the answer into the THM answer field, including a comma , and a space between the countries. Then click Submit.
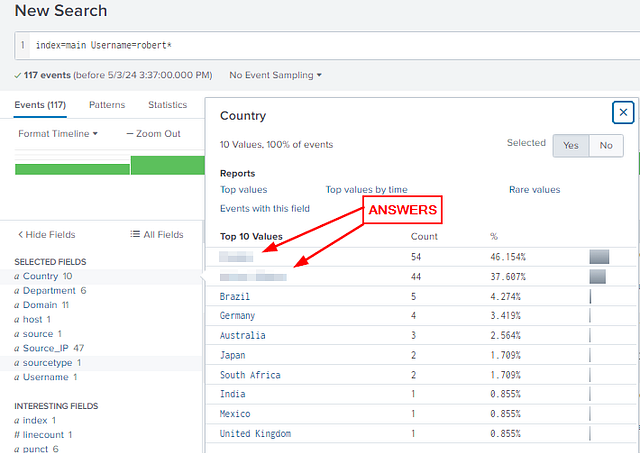
A11: Canada, United States
Q12: Which user accessed the secret-document.pdf on the website?
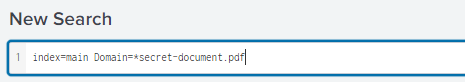
Start off by removing Username=robert*, and pressing enter to clear the search.
We know that the way someone access documents or files is through the Domain. That being said we can do something similair to the above query. This time we will use Domain=*secret-document.pdf. Which will search in the Domain field for anything that will end with secret-document.pdf. Press enter to run the query.
When the query is done running. Look down at the SELECTED FIELDS for Username. You should only see one result.
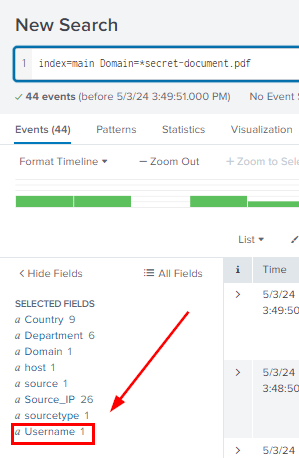
From here you can either click Username or look in the log section on the right to get the answer. Once you do, type it into the THM answer field and click Submit
A12: Sarah Hall
Congrats!!!!!
With hardwork you were able to fix the multi-line event, create custom fields, then search those fields for vital information. Awesome job!!!!